
Table of Contents
Online education comes with many advantages, but also challenges. While it can reduce costs, remove barriers such as distance and commute, and makes learning accessible, it comes with a set of challenges.
Knowing your students/trainees are not as easy in an online environment. Especially if they are hundreds or even thousands.
This is where the role of an LMS as a monitoring and reporting tool comes along. A learning management system’s purpose is to deliver, monitor, and report on the progress of your users. Providing insights to understanding your students, trainees, or employees a little better and acting to improve your educational programs.
| Table of contents |
|---|
| Making Use of Learning Data for Effective Training |
| How to Use User Progress Reporting |
| Examples and Use Cases in Student Progress Reporting |
| Conclusion |
Learning analytics is an essential part of an LMS. It is about making sense of your e-learning data and being able to act on them. This can be the difference between a failed or a successful online training program.
Data can help you understand the performance of the program, identify bottlenecks in learning, review learning KPIs, evaluate the effectiveness of your course, and make data-driven decisions.
With the new User Progress Reports, the power of e-learning data is at your fingertips.
Every online instructor, trainer, or manager can easily interpret and analyze courses, users, and learning activities. LearnWorlds’ student reporting helps you identify patterns, drill down into subsets of your data and anticipate trends, or derive actionable recommendations for improving your work.
The results:
Are you ready to learn how to track, measure, analyze, and report learning data?
Learning analytics is all about understanding your users and making data-driven decisions.
The main functionalities of student reporting are to:
Using the above, you can make decisions that will impact your learners, inform stakeholders, and plan for the future of your business.
Learning Analytics in Education
Knowing your students is an essential part of teaching and learning. Knowing how your students are doing is important. Student progress is a way of knowing whether your learning program is successful or not.
With learning analytics you can view:
… and many more.
The right analytics are also essential to recognizing problems and intervene where needed.
For example, if your course is about teaching cooking, and you see a drop-off in the section for chopping methods it could mean you need to revisit the material of that particular section.
Also, if a lot of learners have a low score in the same exam, it could mean that the material is too hard for their level or presented in a way that is not understandable.
Then, you can move on and make changes to those points. This will help to:
Learning Analytics In Corporate Reporting
When training for the corporate sector, either as an external or internal trainer, reporting on the progress of the employees is essential to your job.
You will need to be able to report on multiple groups of users, departments, locations, or teams.
For example, let’s say you are teaching the new cooks of a restaurant chain on sous vide techniques. The restaurant management would want to know how their employees are doing. There, you will need to be able to segment the cooks from the rest of your students or split them into groups e.g. per restaurant and report on their progress.
Reports on learning can also be used to satisfy upper management of their employees. Or, if you are selling corporate training to other businesses, your clients will want to know how their employees are doing.
Progress reports, certificates achieved, scores, and other KPIs are essential for both cases. Having a reporting center comes handy when you need to produce reports and present the results of your work to the right stakeholders.
When working with many groups of users, you might want to view their progress separately. Some cases might be:
You can easily tag those users and then use the tag as a query in the search results to create a report just for them.
You can then use the report to monitor the progress of specific groups or to create progress reports that will be sent to the team leader, human resources or their CEO.
User progress reports are available on LearnWorlds’ Pro Trainer plan and above and you can find them at the left-side menu.
Click on the User Progress and you will see the reporting screen.
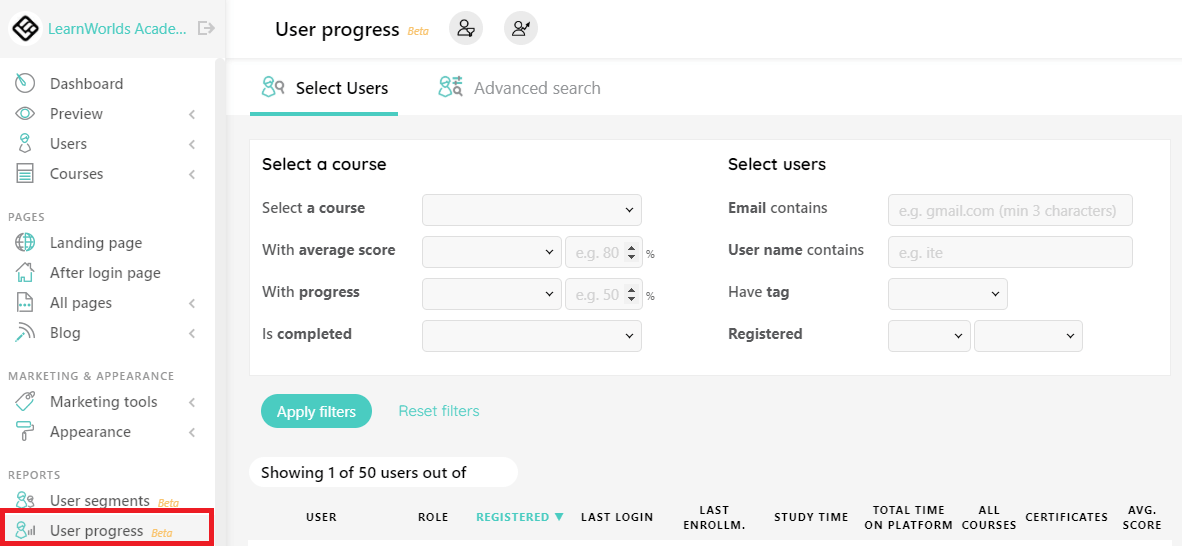
You can use one or more of the available filters to create a report. Those work to filter users by:
You can also use a saved user segment in your report. This will save you a lot of time if you are working with the same group or want a standardized report in regular intervals.
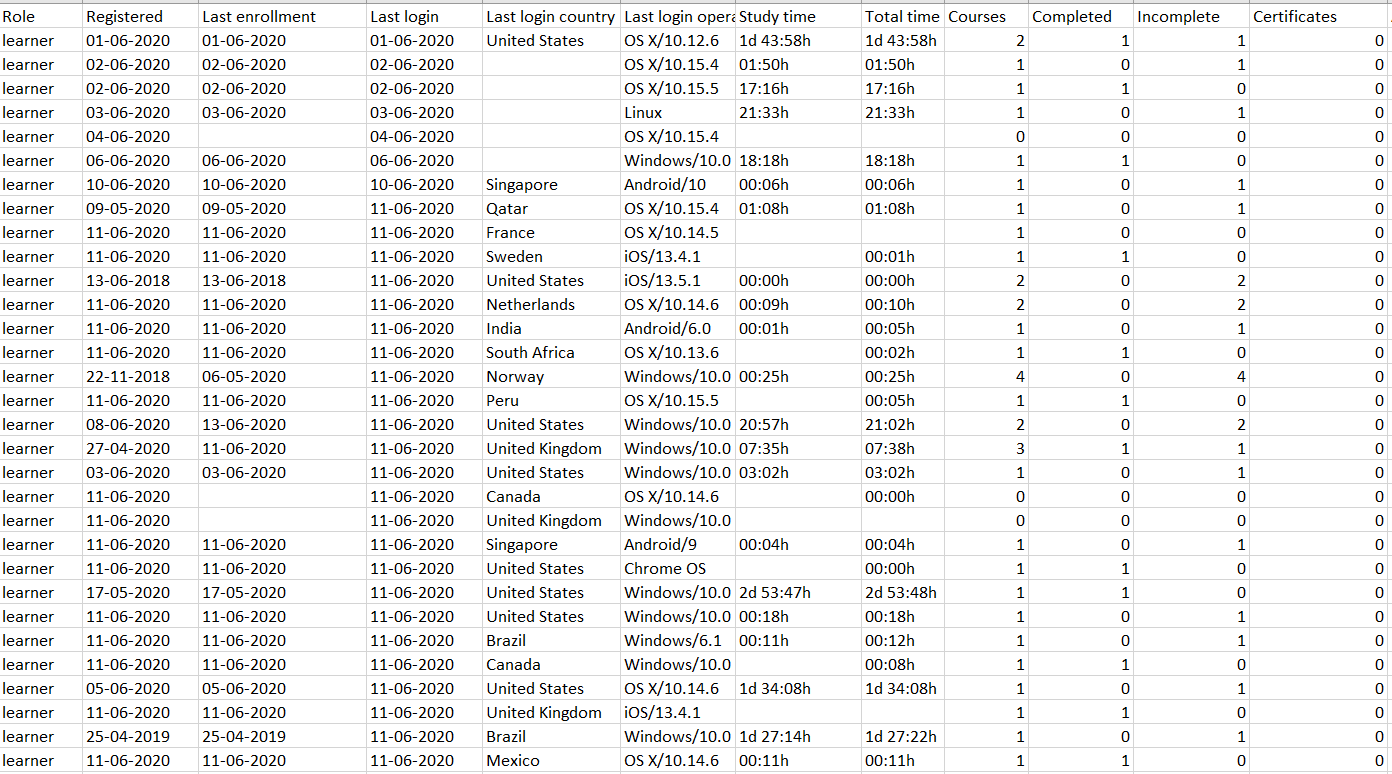
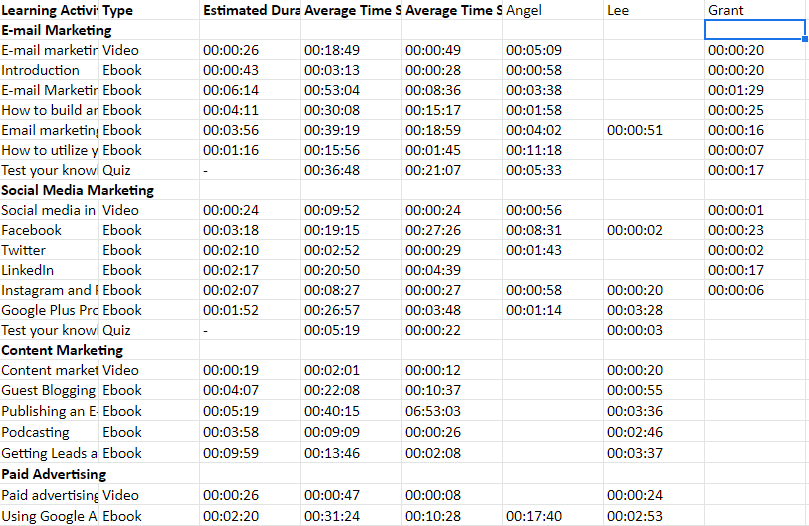
You can also export a csv or xls of the results or view in detail a specific students’ progress report. Below is an example of the activity report, with an export of the latest active users (names & emails have been deducted from the screenshot for privacy reasons):
And, this is only the beginning. The real power comes on the advanced search capabilities.
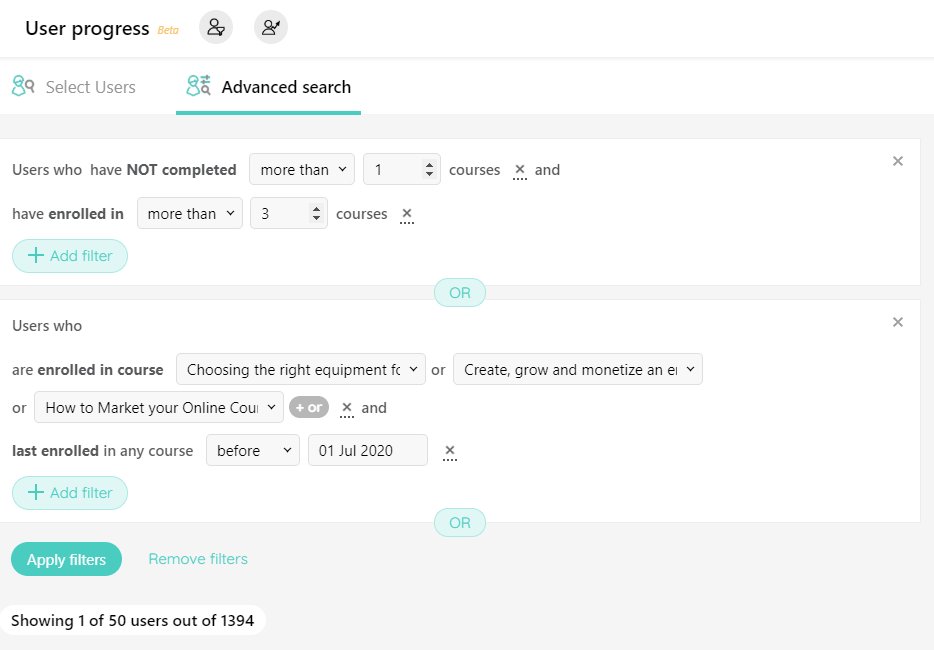
Advanced Search
The advanced search interface of the user progress reporting goes beyond standardized reporting and moves into dynamic queries.
With the advanced search, you can combine 29 types of queries using “and” & “or” functions to create a custom report that will fit your reporting requirements.
*The advanced search in student reporting is available only on Learning Center and above plans of LearnWorlds.
After learning how to create a report, it is time to see a few use cases. What kind of reports can you create?
Simple Reporting
The default reporting option gives you a number of filters you can use and easily segment or report on your students. Using those options, here are a few ideas of what you can do:
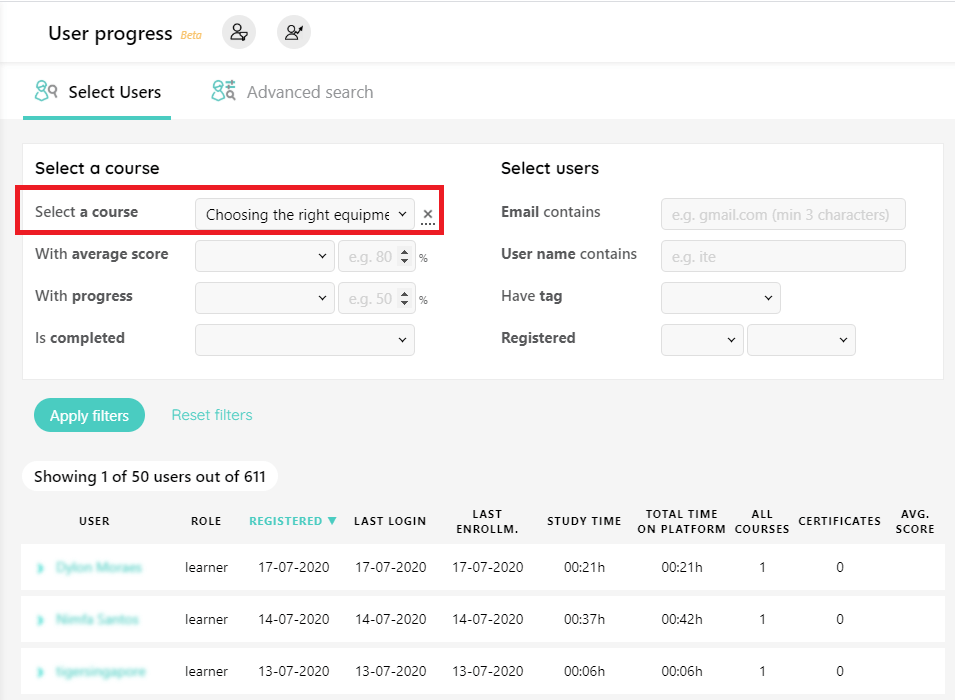
All enrollments in a class
The simplest report is to view who is currently enrolled in a specific course. This will be the basis of most or all of your reports.
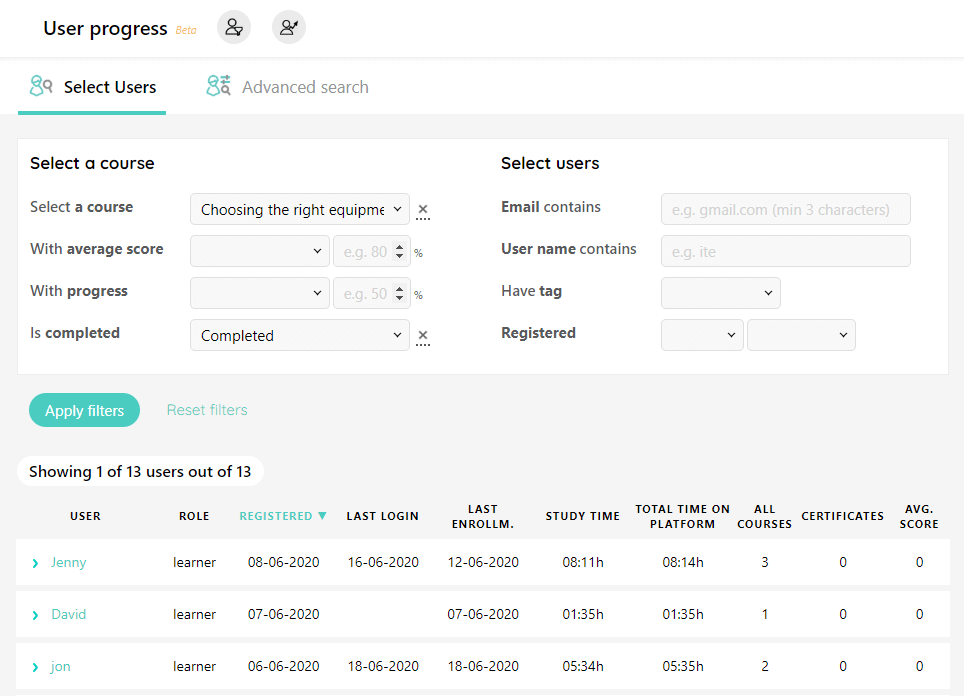
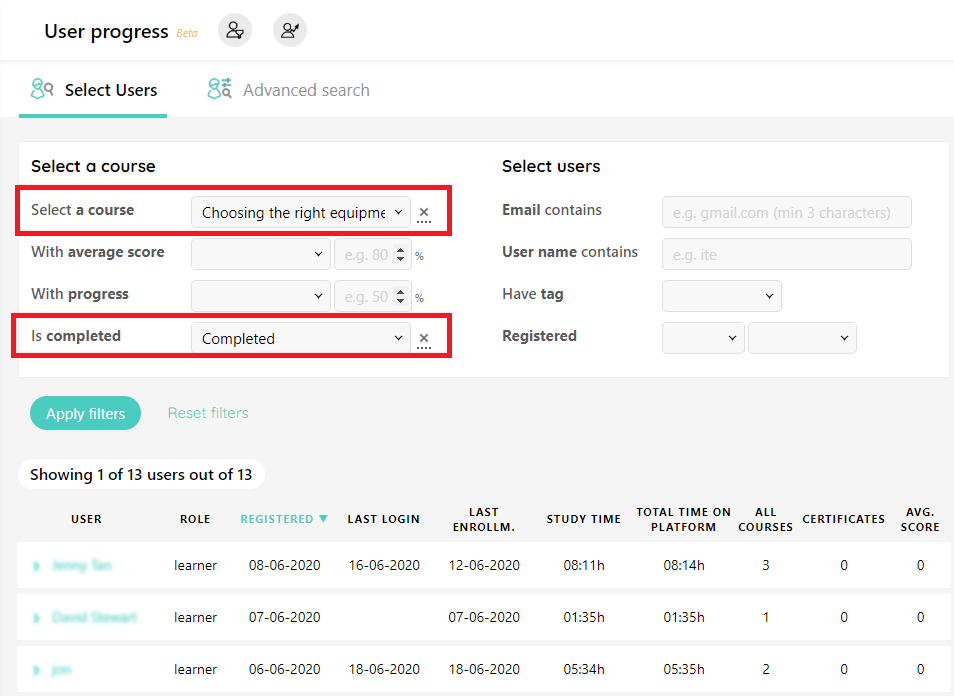
Who completed a specific course
Selecting a course from the dropdown list and choosing the status to be completed to see a list of people who have completed that course.
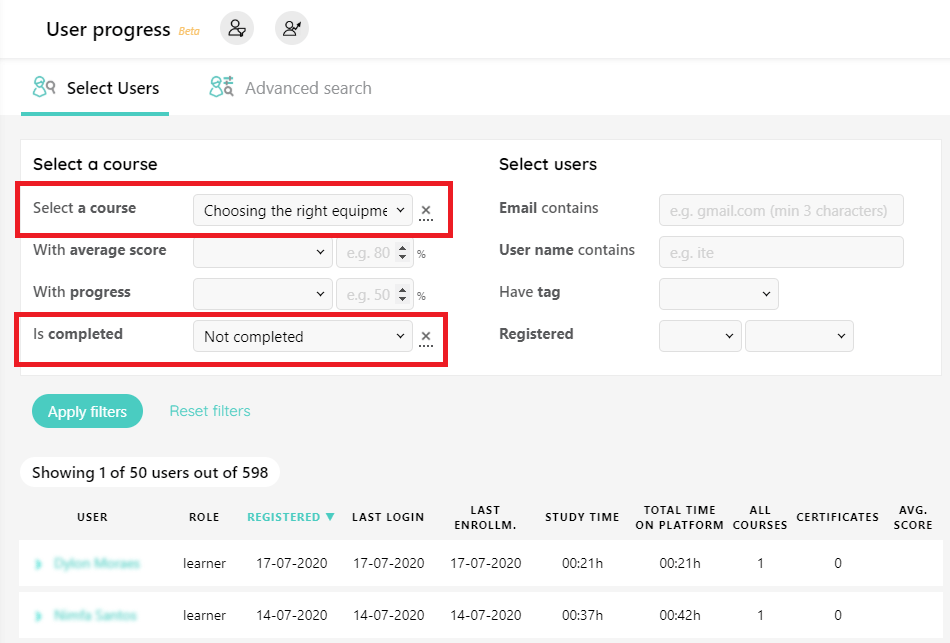
Who did not complete a specific course
Going the other way around, by choosing the course but this time who has not completed it. In this case, I am looking for the users that enrolled by did not complete 100% of the course.
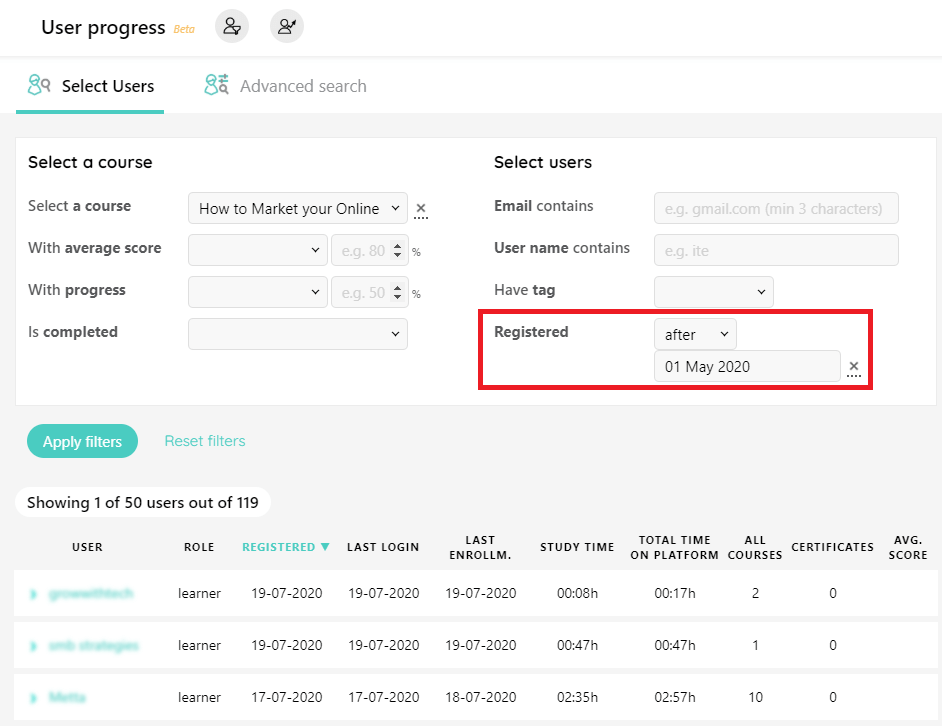
User registered to a course after X date
Looking to find the students who registered after a specific date. In this field, you can also choose to see the students registering before a date or exactly on a specific date.
The advanced search functionality includes the option to look between dates too.
Users by email or a specific domain
In this example, we are looking to find users from a company using the domain name of the company as the search query.
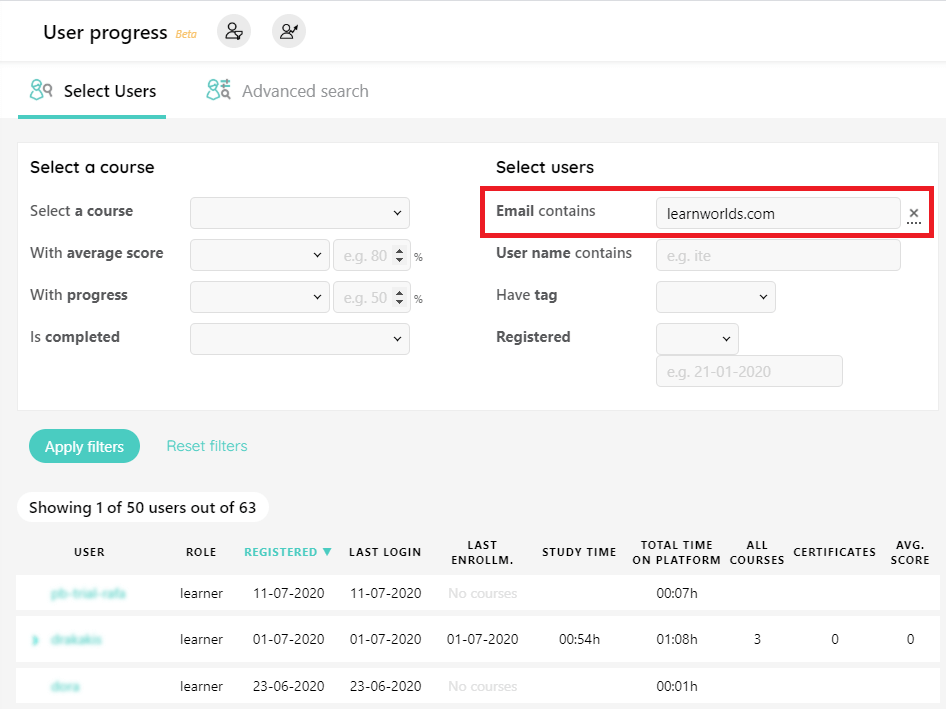
You can also look to find users of gmail, hotmail or other service providers, or you might be looking for a role email e.g. info@…, hr@… or admin@…
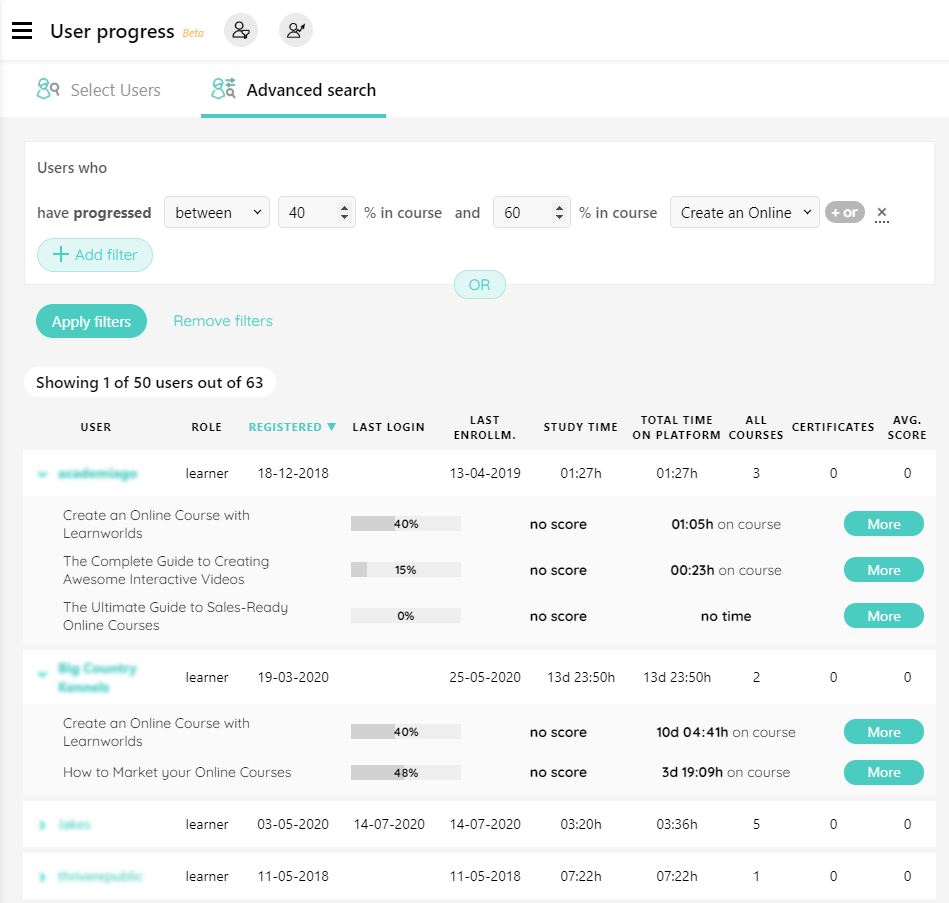
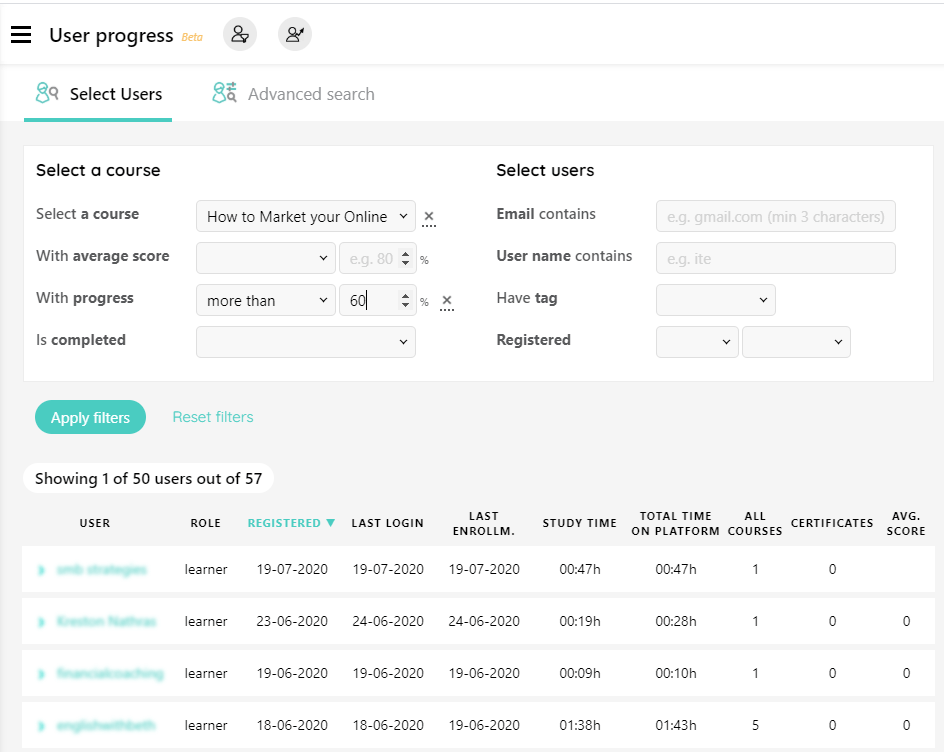
Based on progress
In this case, we are looking for students who have completed between 40% and 60% of a specific course. Other operators could be more, less or exactly the progress.
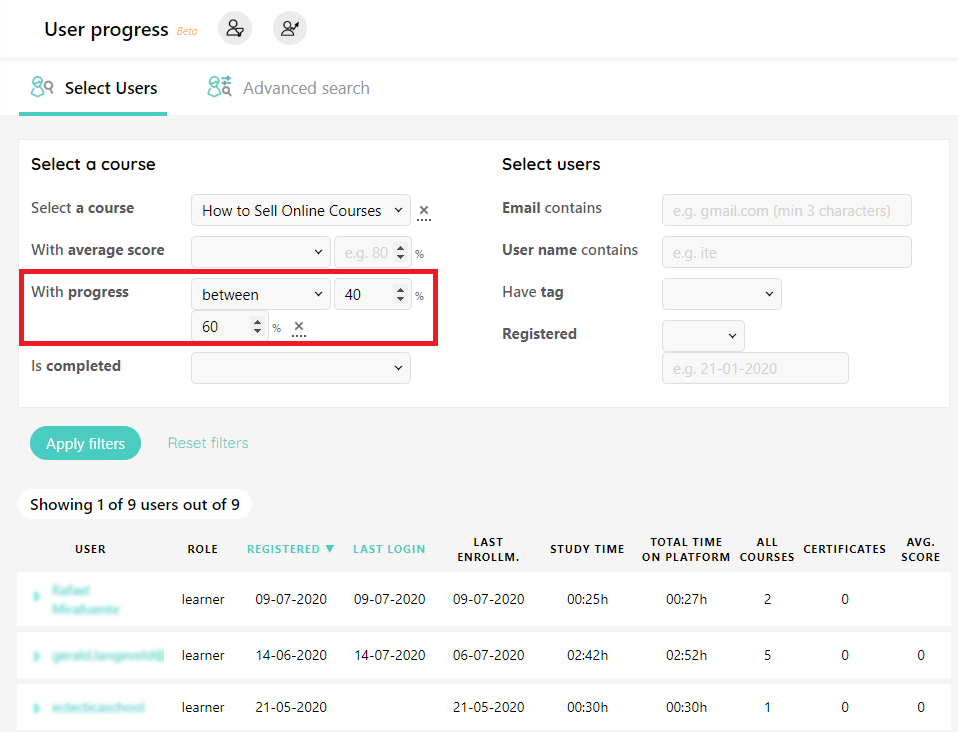
You might be looking to see how many students have finished 80% of the course or are stuck below 50%.
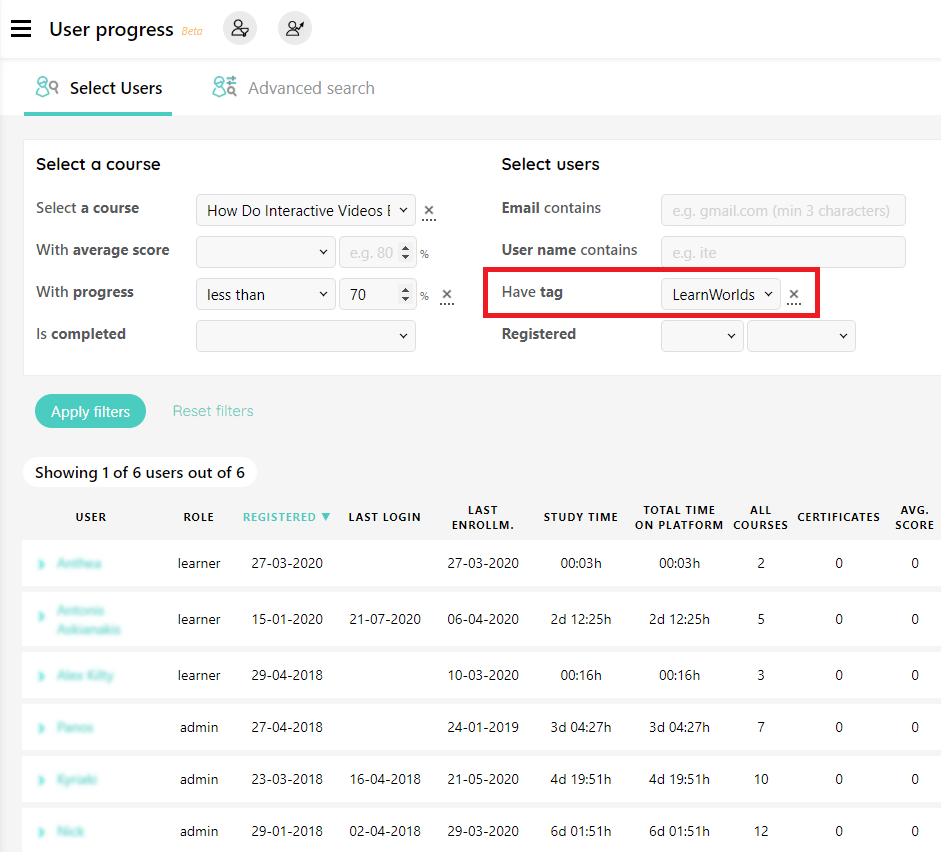
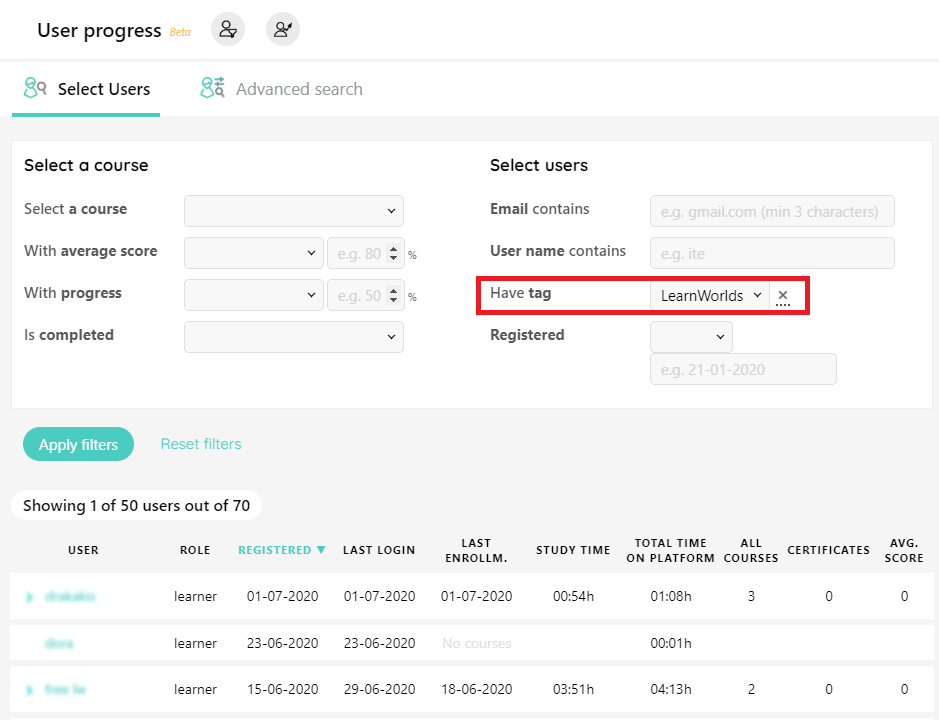
Based on a tag
In this case, we are looking for users tagged for a company. You could create different tags based on enrollments, activity, company, teams or other common characteristics to make it easier to monitor a group of students.
Advanced Search in User Reporting
For the more demanding users, the advanced search allows you to have a deeper look and create combinations of queries for reporting.
Here are a few of the things you can do:
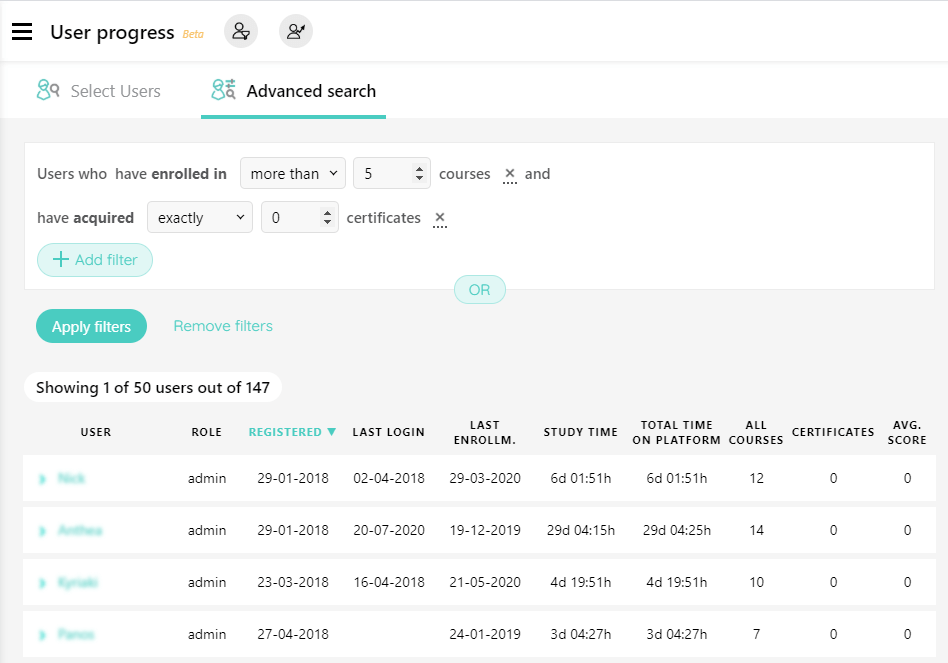
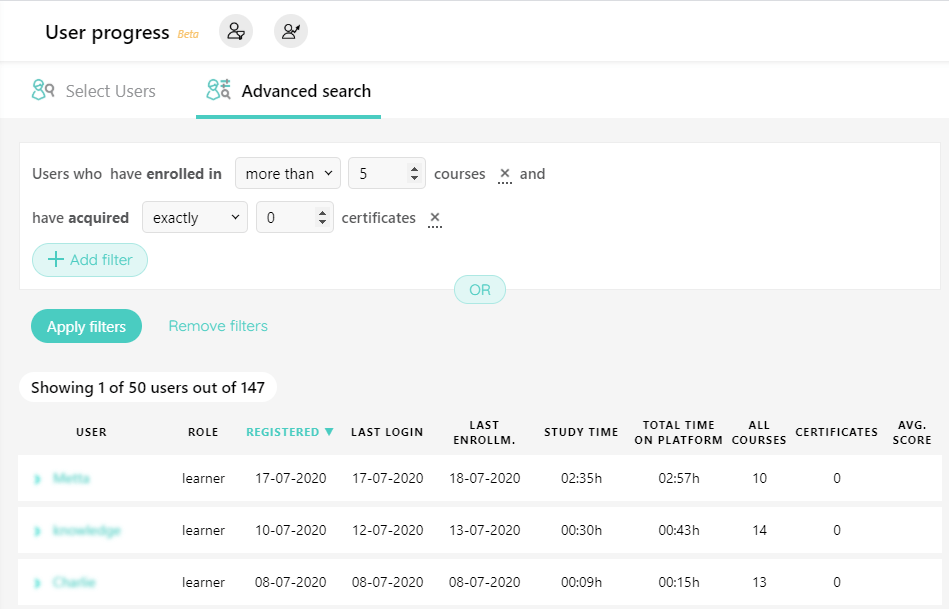
Multiple courses without certificates
You can quickly and easily identify active learners struggling with completing your courses. For example, searching for learners who registered to multiple courses but achieved no certificates can help you identify where you might need to reach out and intervene.
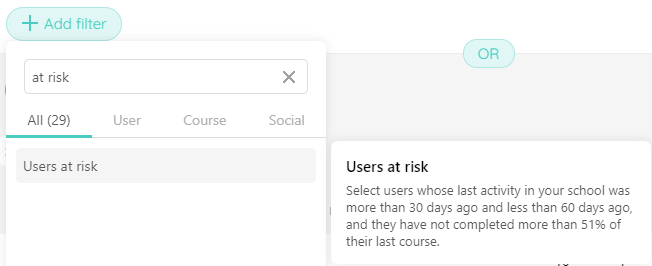
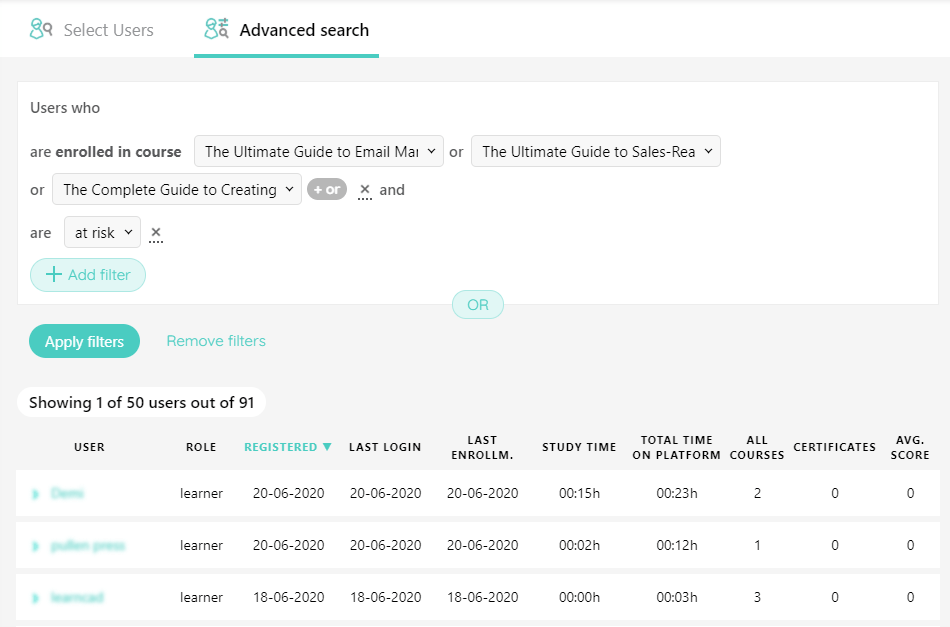
At risk users
At risk users are ones that did have any activity for the last 30days and have not completed more than 51% of their last course. Those are inactive users with low completion that you can reach out and re-activate.
Combining a number of courses, you can see who are the enrolled users in those courses that might be at risk of dropping out. Reaching out to those is an opportunity to reconnect with them and help them continue their learning.
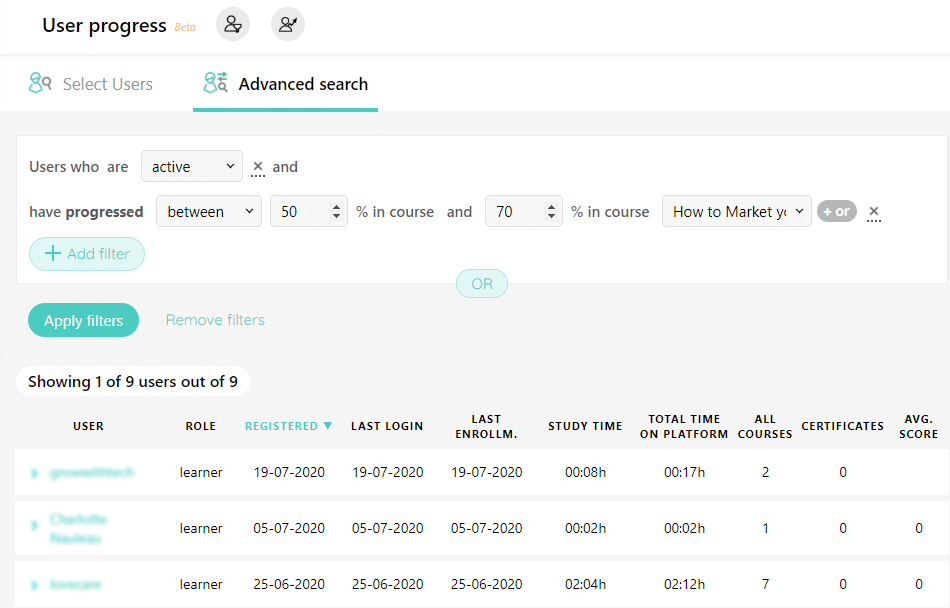
Active users who are currently learning
Another interesting segment are active users. Those are users who have activity during the past 30 days. Combining this information with progress in a course, you can see who are the active users who are near-completion of the course, and might be your most active learners.
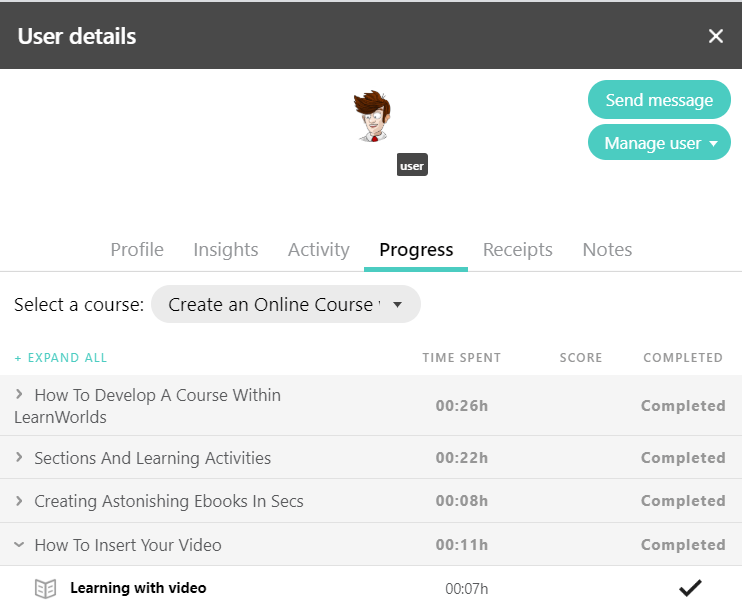
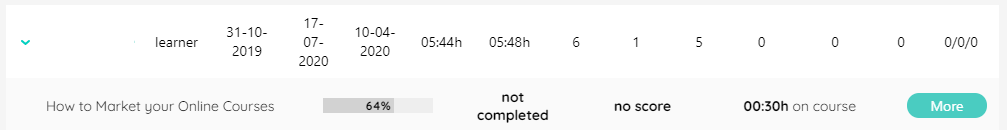
You can even drill down to each course and see more information on where each of those students are by clicking on their name like below.
Preset Segments
Another useful function are the present segments. Useful “quick reports” you can get by clicking on the preset segments button (see the red circle).
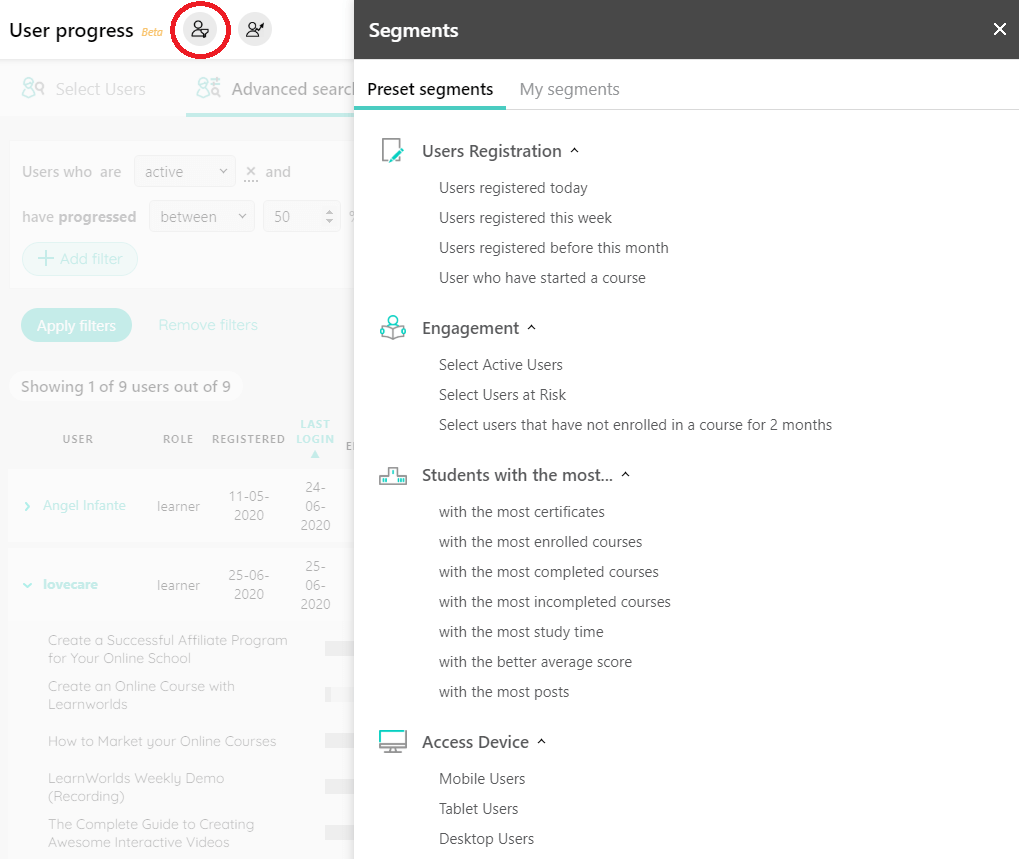
You can even create your own preset segments from the user segments reporting function.
Preset segments allow you to save and re-use reports you will need, for example if you want to run a report weekly or monthly, you don’t need to re-do the work every single time.
This is a real time-saver!
Exports
Going deeper into the learners’ analysis you will find LearnWorlds’ ability to export those detailed progress reports. This gives you another powerful tool to analyse what your learners are doing at a bigger scale.
You will find the export button at the top of the User Progress menu. The normal report will give you the same top-level data you are already seeing in the report.
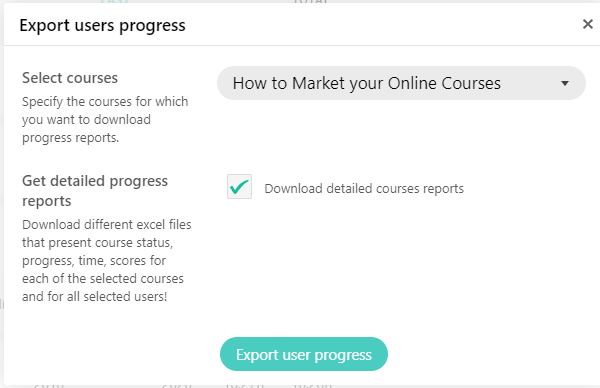
By clicking on the “Download detailed courses report”, you will get a very detailed analysis of each students’:
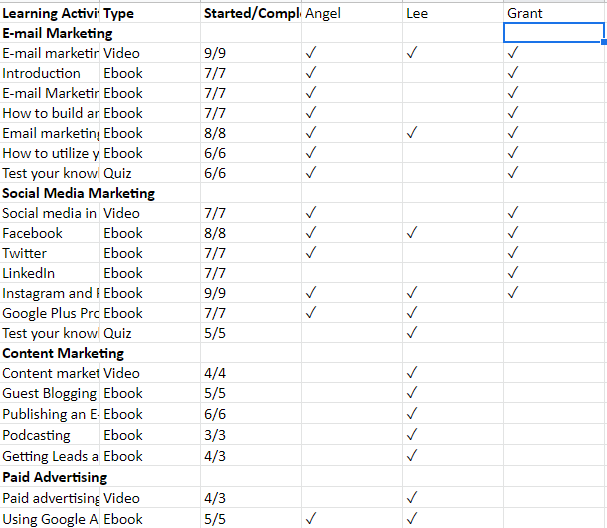
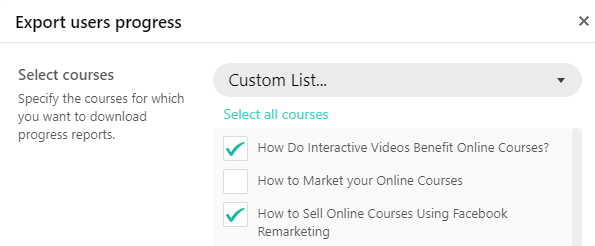
You can also choose to download reports for multiple courses by selecting the custom list option and checking their box:
User progress exports can be used for reporting to management, crunching numbers in excel or to understand how your students watch and interact with your courses.
Getting to know your students is an essential part of being an educator. When teaching or training online, this comes as a challenge and an opportunity.
With LearnWorlds’ new reporting center, we tackle this challenge and give you the insights to get ahead of the competition. By knowing your students and acting upon the understanding to improve your courses and connect at the right moments, in order to achieve the learning goals you have set for them.
On the other hand, it’s also a tool to sell corporate training with the capability to provide reports to management and stakeholders.
With this new update, all the e-learning data you have ever wanted is in your fingertips!
Are you ready to give it a go?
Your professional looking Academy in a few clicks
Start FREE Trial
Nick Malekos is a Senior Digital Marketer in LearnWorlds. He is a results based and well-rounded Digital Marketer with years of experience in the education industry, writer and digital literacy trainer.

